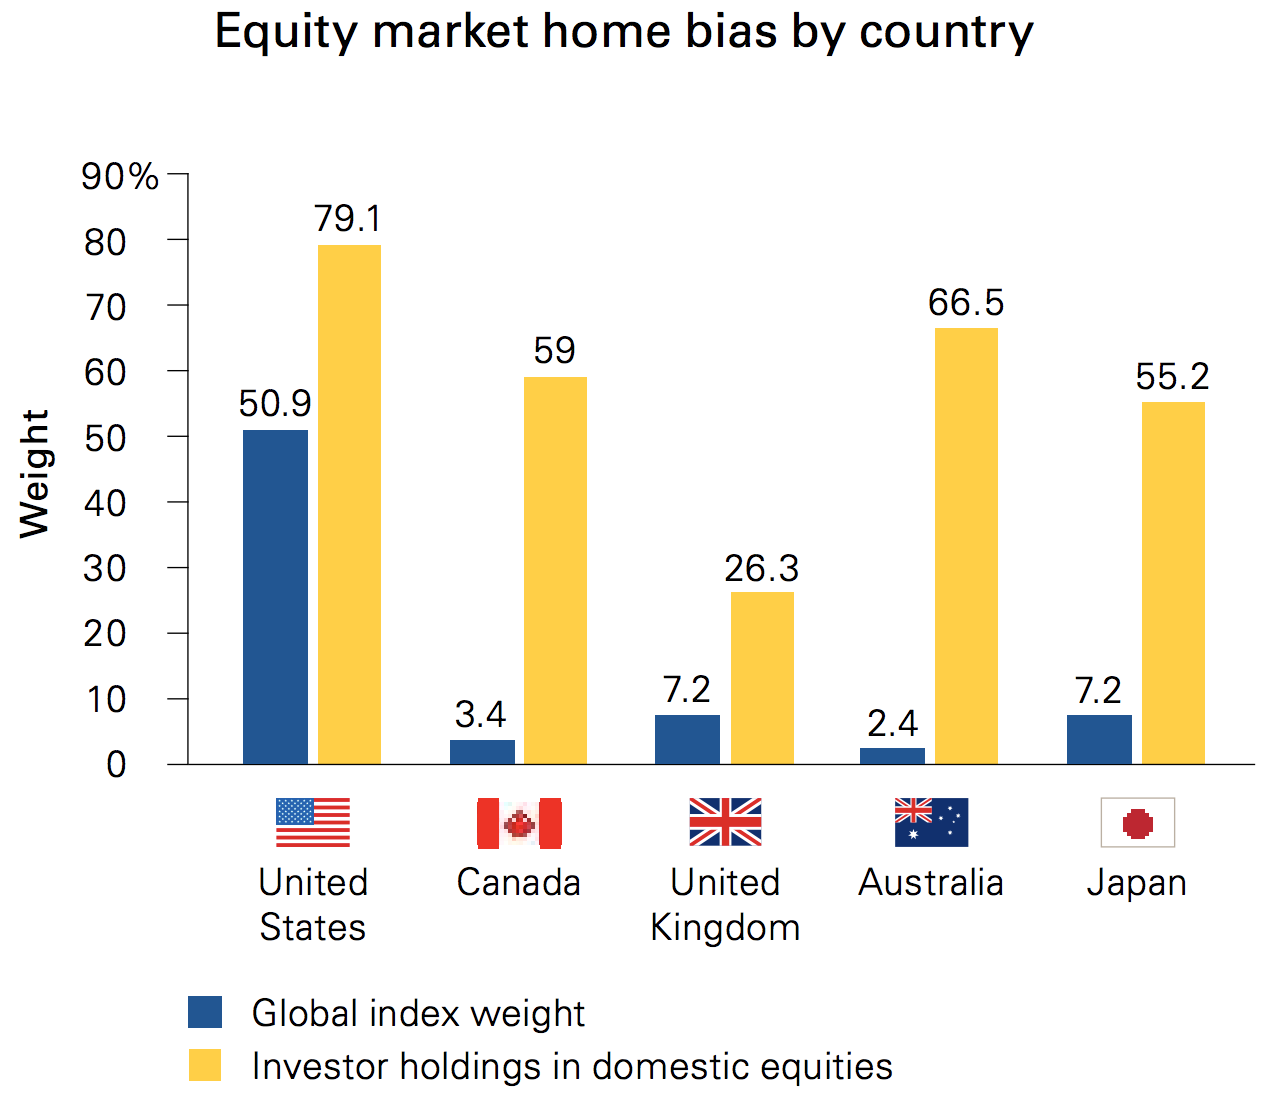
Many investors hold portfolios concentrated in domestic stocks, a practice known as “home-country bias”, but is this really the smartest strategy? Just take a look at this chart.
 Source: 1
Vanguard did a study and found that investors have, on average, a home-country bias, where they tend to own more equity of their resident country than the market-cap weighting would suggest. For example, as of December 31, 2014, Canadian equities accounted for 3.4% of the global equity market. To the extent investors choose to invest in the global market regardless of their home country, they would hold 3.4% of their equity portfolio in Canadian stocks. But, on average, this was not the case among Canadian investors, who collectively held 59% of their equity portfolio in Canadian stocks at year-end in 2014. This situation was the same in each country that Vanguard analyzed.1
U.S.-based investors are no different. Over the past several years, this “home-country bias” approach has produced positive results, but it might not be optimal in the long run. Let’s take a look at some of the practical reasons globally diversified investments makes sense.
1. Countries Perform Differently
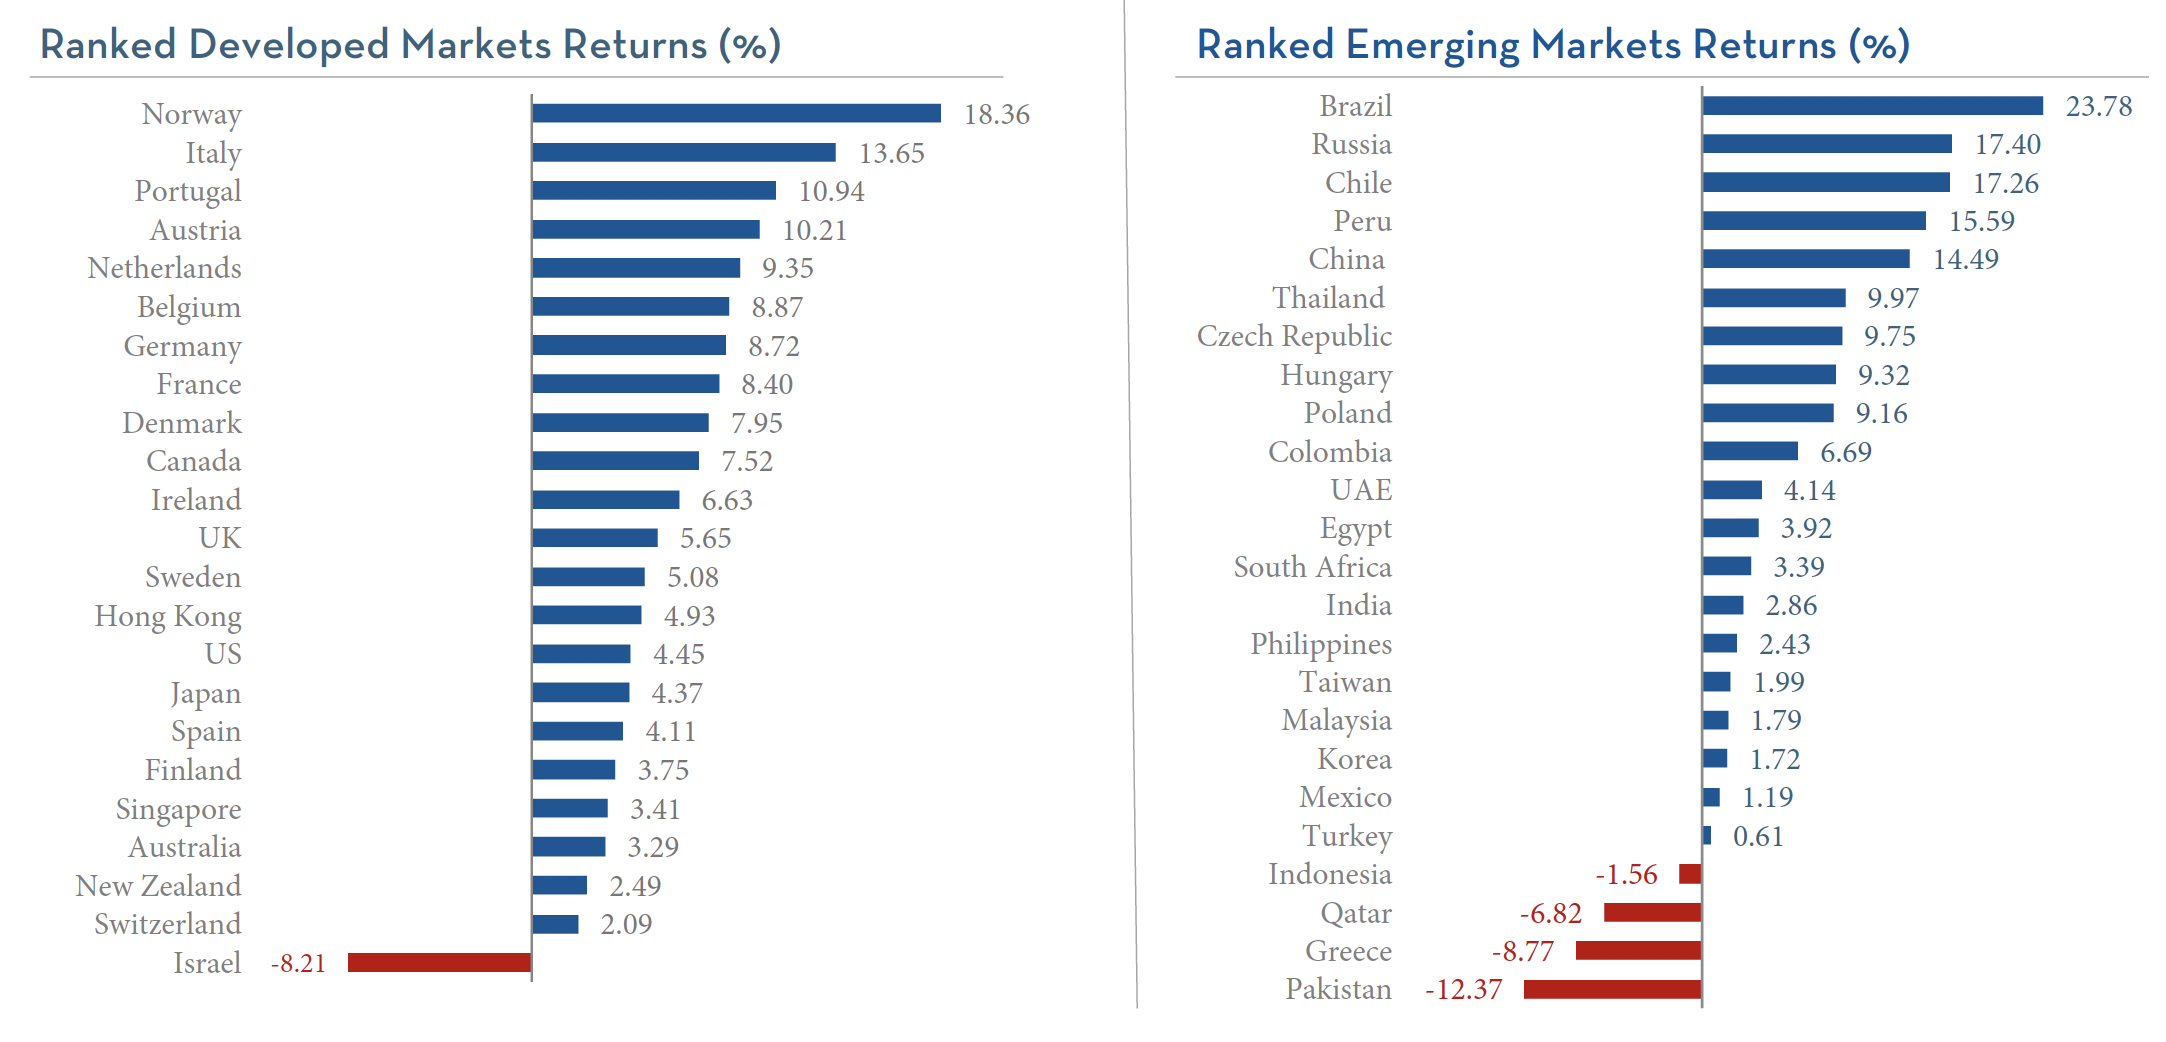
At any given time, performance among various countries can vary greatly. For instance, from July 1, 2017 – September 30, 2017, there was a 35% difference between the best performing national market (Brazil +23.78%) and the worst performing market (Pakistan -12.37%)2. There are a multitude of reasons why this might occur, and sometimes the divergence can be chalked up to nothing more than statistical noise.
Nevertheless, let’s look at some of the main reasons performance among countries might vary:
- Different points in the economic or business cycle: future market returns can vary depending upon where a country is in the economic or business cycle.
- Different political environments: elections, domestic politics, and foreign affairs can all influence stock market performance, and countries may be experiencing relative political calm or turmoil at any given time.
- Different exposures to risk factors: external events affect countries differently. For instance, all else being equal, rising oil prices hurt the economy of an oil importer (like Japan) while helping the economy of an oil exporter (like Saudi Arabia.)
- Different market sector concentrations: market performance is heavily influenced by which sectors are in or out of favor, and national markets have sector concentrations that vary widely. For instance, many Canadian and Australian companies focus on natural resources, while Taiwan and South Korea are dominated by information technology.
- Different valuation and sentiment levels: at any given time, some countries will be in a bull market and others in a bear market. Future market performance can vary greatly, depending upon the starting point from the perspective of valuation and sentiment.
Learn more about diversifying your taxes as well as your investments here.
2. Shifting Tides
Over the past several years, U.S. markets have enjoyed a strong run, outperforming most other nations. Here’s a look at 3-year annualized returns for several domestic and international mutual funds, which should provide a representative sample regarding performance differentials.
| US Micro Cap* | 12.73% |
| US Small Cap | 11.76% |
| US Large Company | 10.75% |
| US Core Equity 1 | 10.29% |
| Intl Small Company | 10.14% |
| Intl Core Equity | 7.11% |
| EM Small Cap | 6.20% |
| EM Core Equity | 4.95% |
| Intl Value | 4.75% |
*3-year annualized returns for Dimensional Funds (as of 9/30/17)
However, more recently international stocks have begun to outperform. In fact, even though the U.S. produced a strong 4.5% return in the third quarter, that performance lagged behind two dozen other national stock markets2. Those results can also be seen in fund performance, where U.S. returns were strong, but global markets did even better.
| Intl Value* | 8.30% |
| Intl Small Company | 6.98% |
| Intl Core Equity | 6.93% |
| US Micro Cap | 6.54% |
| EM Core Equity | 6.54% |
| EM Small Cap | 6.07% |
| US Small Cap | 5.42% |
| US Core Equity 1 | 4.83% |
| US Large Company | 4.47% |
*Q3 returns for Dimensional Funds (as/of 9/30/17)
To be clear, I don’t claim to have a crystal ball and I’m uncertain which markets will do best going forward. Instead, my takeaway from the data above is that I want to own both domestic and international markets, particularly given the portfolio construction benefits of global diversification.

3. Portfolio Construction with Global Diversification
The goal when constructing a portfolio is to find a mix of asset classes or securities that combine as a whole, greater than the sum of its parts. In other words, you want to add assets so that either:
- The potential return of the portfolio increases, or
- The expected risk of the portfolio decreases
Practically speaking, the way to achieve this is by combining assets that have correlations less than 1.0 (a correlation of 1.0 would indicate that the assets move in lockstep with each other.) The Holy Grail is to find assets with a negative correlation so that they move opposite from each other. But even assets with no correlation, or positive (but not perfect) correlations can enhance portfolio construction.
Because global stock markets are not perfectly correlated with each other, adding additional countries to the investment mix can enhance expected risk-adjusted returns. The precise mix of countries and markets is as much art as science, but the key point is that under many circumstances a globally diversified investments can be constructed to:
- Produce higher expected returns than a domestic portfolio, or
- Produce comparable returns to a domestic portfolio, but with less risk
Note: A crucial point to remember is that correlations amongst markets are not static, and as such, the optimal asset mix can change over time. Additionally, in times of crisis, many correlations tend to “move towards one” even if over the long run they tend to be less correlated. Therefore, global diversification is something to be evaluated and practiced over the long run, not in a vacuum or over a shorter time frame.
Conclusion
International stocks have gained momentum recently, even as domestic stocks continue to move higher. Despite this, many investors remain under-allocated to global equities. Given the benefits of global diversification, I believe this is a mistake, as globally diversified investors are likely to achieve superior risk-adjusted returns over time.

Sources & Disclosures
1: Vanguard Research: The global case for strategic asset allocation and an examination of home bias
https://personal.vanguard.com/pdf/ISGGAA.pdf
Notes: Data as of December 31, 2014 (the latest available from the International Monetary Fund, or IMF) in U.S. dollars. Domestic investment is calculated by subtracting total foreign investment (as reported by the IMF) in a given country from its market capitalization in the MSCI All Country World Index. Given that the IMF data is voluntary, there may be some discrepancies between the market values in the survey and the MSCI ACWI.
Sources: Vanguard, based on data from the IMF’s Coordinated Portfolio Investment Survey (2014), Barclays, Thomson Reuters Datastream, and FactSet.
2: MSCI data © MSCI 2017, all rights reserved. UAE and Qatar have been reclassified as emerging markets by MSCI, effective May 2014.
Past performance is not a guarantee of future results. Indices are not available for direct investment. Index performance does not reflect the expenses associated with the management of an actual portfolio. Country performance based on respective indices in the MSCI World ex US IMI Index (for developed markets), MSCI USA IMI Index (for US), and MSCI Emerging Markets IMI Index. All returns in USD and net of withholding tax on dividends.
Data as of December 31, 2014 (the latest available from the International Monetary Fund, or IMF) in U.S. dollars.