A client recently posed a question to me:
“There seems to be an unusual degree of economic uncertainty right now. Should I sit on the sidelines until things settle?”
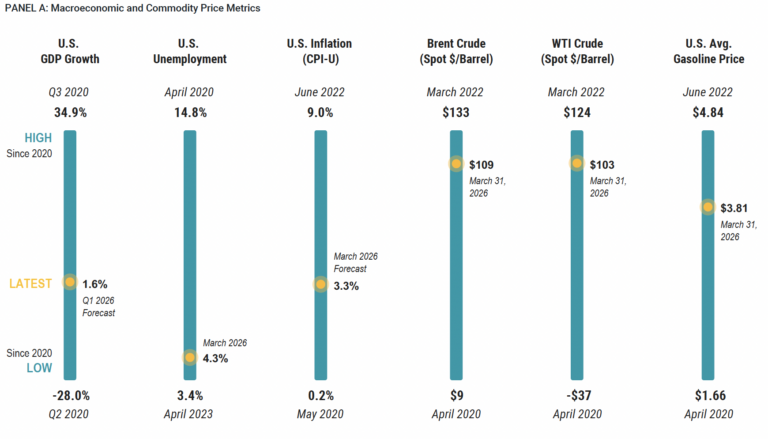
In crafting my answer, I came across the following chart from Avantis Investors, which highlights the almost staggering ranges we’ve seen in various economic indicators and commodity prices. What was most interesting to me was that these fluctuations are just those that occurred in the past six years.
Investors Have Faced a Wide Range of Headline Data Since 2020
Unemployment Source: U.S. Bureau of Labor Statistics (BLS). U.S. Inflation Source: U.S. Bureau of Labor Statistics (BLS) and the Federal Reserve Bank of
Cleveland’s Inflation Nowcasting. Brent Crude, WTI Crude, and U.S. Average Gasoline Price Source: U.S. Energy Information Administration (EIA).
Source: Avantis, Monthly ETF Field Guide, March 2026.
Just since 2020, U.S. economic growth (GDP) has fluctuated between positive 34.9% and negative 28%. Brent Crude Oil has been as expensive as $133 a barrel and as cheap as $9. Inflation has been as high as 9% and as low as 0.2%. just for context on that last point…the difference between 9% inflation and 0.2% inflation is the difference between your cost of living roughly doubling every 8 years versus every 300 years!
Now, granted, the last half dozen years have featured some unusual events, including:
- COVID in 2020
- Russia invading Ukraine in 2022
- A historically sharp increase in inflation and interest rates in 2022
- Tariffs in 2025
- War with Iran in 2026
The bottom line is, things have been a little crazy, which is part of the reason we have seen such large ups and downs in the economic cycle. But ask yourself this: When haven’t things been a little crazy? And do you expect everything to calm down and the world to go quiet in the coming years and decades?
No? Well then, let’s look at whether markets have been able to survive against a backdrop of broad economic swings.
So, what has this Meant for Investors?
Here’s the key takeaway: Despite these broad fluctuations in GDP, inflation, energy prices, etc., stock markets in the United States and abroad have performed quite well over the last half dozen years.
Periods of Heightened Volatility Since 2020 Have Not Prevented Growth from Global Stocks
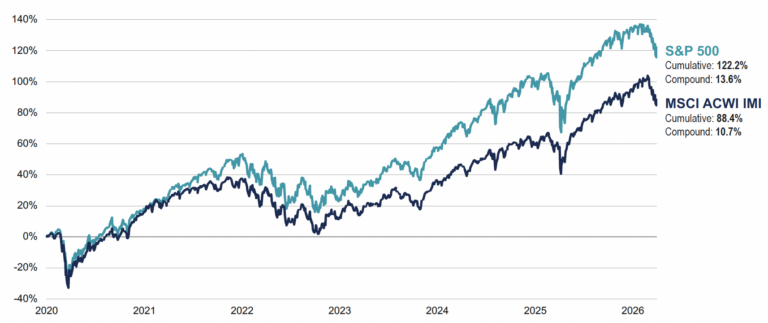
Source: Avantis, Monthly ETF Field Guide, March 2026.
The move higher has not occurred in a straight line; there have been periods of volatility. But that is always the case, and we expect that to continue. For instance, as of this writing some analysts worry that inflation will increase due to elevated energy prices. Still others fear an economic slowdown.
We don’t pretend to know what the future holds. However, we are highly confident there will be many surprises, some positive, some negative. That statement holds true for exogenous events such as politics, wars, etc.
It also holds true for the economy and its various indicators; in future years GDP growth and inflation will surprise both to the upside and the downside. Oil will move higher and lower.
Corporate profits will also fluctuate as companies navigate the competitive environment as well as geopolitical and economic swings. Collectively though, and over time, we expect corporate profits to increase. And, since it is ultimately corporate profits that drive stock market performance, we also expect stock prices to move higher, driven by that long-term profit growth and increasing economic prosperity.
Plan for the Unexpected
Once you accept that both the external environment and the markets are going to be volatile, the question becomes what to do about it. Well, financial planning is one of the most powerful tools available to combat uncertainty. Starting with reasonable assumptions based upon historical precedence and incorporating judgment and expertise, you can build a game plan that lays out what returns your portfolio needs to achieve for you to meet your financial goals.
From there, you can determine the best way to maximize the tax efficiency of your investments. And finally, you can evaluate a suite of strategies designed to help navigate volatile markets. Some of these strategies might include:
- Accelerating Roth conversions when markets are down
- Tax-loss harvesting in non-retirement accounts
- Systematically rebalancing your portfolio to buy low and sell high while maintaining a consistent risk profile.
The Bottom Line
The past half dozen years have been characterized by large economic fluctuations. For much of that period, investors have been worried that inflation was too high, or too low. Or that economic growth was too weak or oil prices too high. Yet, despite these concerns, stock markets both in the U.S. and around the globe have performed well, rising on the back of increasing corporate profits. Hopefully, this stock market performance during periods of economic volatility serves as a reminder that even in the face of economic uncertainty today, markets are likely to move higher in the years ahead.
Next Steps:
- Review your financial plan and investment portfolio to make sure you are prepared for whatever the future might hold.
- Consider and implement tax strategies such as Roth conversions and tax-loss harvesting to take advantage of market volatility.
- Take a deeper dive into your overall financial situation using our free Financial Blueprint.