October 2024
With an impending election, this is a good time to review how markets have performed during various political cycles, as well as to look at some possible outcomes in 2024.
For starters, it’s important to realize that people’s perceptions of the economy can vary drastically depending on whether the party they favor is in power. As the chart below demonstrates, Republicans and Democrats often have strikingly different consumer confidence readings, depending on the party in office. The truth though, is often somewhere in the middle. In other words, when a Republican is in office, the economy probably isn’t as good as Republicans think nor as bad as Democrats think. The reverse is also true when a Democrat is in office.
Percentage of Republicans and Democrats who Rate National Economic Conditions as Excellent or Good

Source: Pew Research Center, J.P. Morgan Asset Management Guide to the Markets. Pew Research Center, “Republicans, Democrats Move Even Further Apart in Coronavirus Concerns.” Question: Thinking about the nation’s economy, How would you rate economic conditions in this country today… as excellent, good, only fair, or poor? The survey was last conducted in March 2023.
The Market Tends to Move Higher, Regardless…
The reality is that, as seen in the chart below, the stock market has generally risen regardless of who was in office. That makes sense, given that there is a long-term upward trend to markets. Furthermore, the president is only one factor in the direction of the economy and markets. Other factors, including the Federal Reserve, global events, corporate profits, technological developments, and starting valuations also play equal, if not greater roles, in determining market outcomes. For instance, though stocks did poorly under George W. Bush. Much of that had to do with the bursting of the tech stock bubble at the start of his first term, as well as the Financial Crisis at the end of his second term. Both of those events were not entirely within his control. Similarly, the robust market performance under Obama was due at least in part to very low starting valuations as a result of the Financial Crisis.
S&P 500 Performance by President

As far as timing, as you can see below, markets have historically risen in election years, as well as during the first year of a presidential term.
S&P 500 Index Returns based on 4-year Presidential Cycle (1955-2023)

Note: As of December 2023. Past performance is not a guarantee or a reliable indicator of future results.
Sources: PIMCO, A View from Washington, August 2024; LPL Research, Factset.
Furthermore, stocks performed well during the first year of Trump’s presidency, as well as during the first year of the Biden/Harris ticket.
S&P 500 One Year Performance: Post-Trump vs Post-Biden Election

Sources: PIMCO, A View from Washington, August 2024; Bloomberg.
The Song Remains the Same
As of this writing, it’s hard to say who will win the election. And importantly, Congress is up for grabs as well. In fact, a divided government of some sort seems to be the most likely outcome.
The Race is a Toss Up

Source: PIMCO, A View from Washington, August 2024.
Regardless of who wins the election, there are several things that are unlikely to change. The first is that the dollar isn’t going anywhere. This is despite growing concerns about ballooning deficits and rampant government spending. The fact of the matter is that the dollar is just too dominant in the global financial system, as you can see below. Furthermore, there aren’t really any viable alternatives to the greenback.
US Dollar Share of Global Markets

Sources: HSBC graph based on: (1) BIS, “The Global Foreign Exchange Market in a Higher-Volatility Environment” (December 20 22). G Gopinath, “The international price system”, NBER Working Papers, no 2164, 2015; IMF; Bloomberg; CPB World Trade Monitor; SWIFT; BIS debt securities statistics; BIS locational banking statistics; BIS Triennial Central Bank Survey. Foreign Affairs (“Great Powers Don’t Default: The Dangers of Debt Ceiling Brinkmans hip” by Matt Pottinger and Daleep Singh); PIMCO, A View from Washington, August 2024.
One thing to keep in mind though is that it’s almost impossible to cut spending enough to balance the budget. As the chart below shows, if you exclude Social Security, Medicare, and Defense, all other spending would need to be cut by 85%!
Percent of Spending cuts Needed to Balance the Budget by 2033

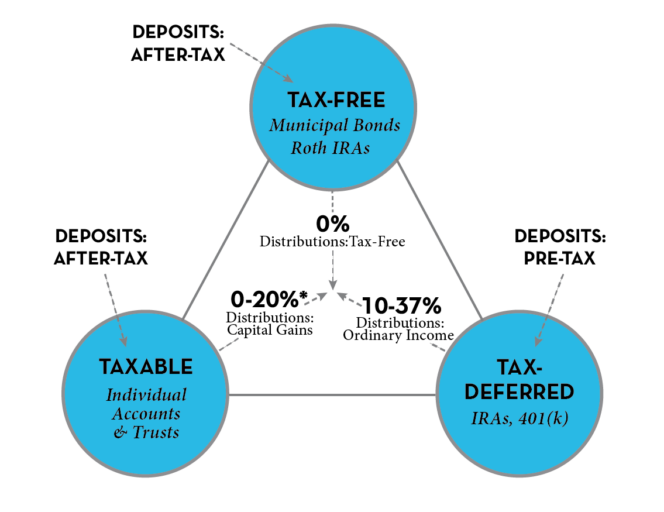
Tax Diversification
Spending cuts of the magnitude in the chart above are almost certainly impossible, which leads to the likelihood that over time taxes need to move higher. In fact, higher tax revenues are the only way it seems possible to balance the budget. That is why we constantly focus on forward tax planning, and making sure that you create a situation where you retain some level of control over your future taxes. The best way to do that is to make sure that you own assets in a variety of different account types. This concept, known as tax diversification, is illustrated below, and is one of the keys to achieving your future financial goals.
The Bottom Line
The bottom line is that politics are just one of many factors that determine the direction of markets. Furthermore, markets have generally risen regardless of who is in Washington or what they do. Identifying an appropriate portfolio mix, shifting that mix over time as appropriate, and tax managing your portfolio and your retirement distributions all play a much bigger role in your financial success than anything emanating from the political arena.
Next Steps:
- Review your account(s) to determine if your asset allocation and investment mix is in line with your strategic allocation.
- Identify your current tax bracket and forecast your future tax burden to determine what tax moves to make now.
- Take a deeper dive into your overall financial situation using our free Financial Blueprint