
With the recent political transition, as well as questions around what’s next for the Federal Reserve and the economy, we wanted to take this opportunity to address some of the more common items we are discussing with clients. We also wanted to provide some context for long-term investors and help them keep perspective on current events.
Q: I’m worried about the future. What should I do?
A: To begin with, it’s important to realize that a lot has happened over the years.
For instance, consider some of the events a person born in 1960 has experienced during their lifetime:
Sample news headlines since 1960:
- A global pandemic shut down the world
- 1/3 of presidents either shot or forced to resign from office
- 18% mortgage rates and 0% savings account rates
- An assault on the U.S. Capitol Building
- War in the Middle East, Vietnam, Afghanistan, and Ukraine
- Constant threat of nuclear Armageddon throughout the Cold War including the Cuban Missile Crisis
- A contested election that had to be decided by the Supreme Court
- The end of the gold standard backing the US Dollar
If space allowed, we could, of course, add many more events, but even a short list serves as a reminder that there have been numerous challenging events over the past 65 years. But despite these headwinds, the United States economy and companies both at home and abroad have demonstrated tremendous growth, though not without occasional peaks and valleys. The result is that despite the backdrop in the sample headlines above, the Dow Jones Industrial Average, which was at approximately 600 in 1960, today stands above 40,000.
With that historical perspective in mind, while we freely acknowledge that we don’t have a crystal ball, we also strongly suspect that no matter what occurs in the years to come, long-term investors with globally diversified portfolios will turn out just fine.
Q: But what if the market falls?
A: It’s important to accept that market selloffs are a regular occurrence.
Let’s acknowledge that no one likes seeing markets fall and their portfolio balances decline. But the reality is that market selloffs are a normal part of being an investor. In fact, the stock market as a whole declines roughly 3 out of every 10 years, and yet in the long run, the stock market has created wealth for generations of investors. The key is to accept that volatility is likely to occur at some point each and every year, and that as long as you don’t need to sell during those periods, you shouldn’t let these normal occurrences cause you undue stress.
In fact, as the chart below shows, despite rising in three out of every four calendar years, the stock market has experienced an average intra-year decline of 14%, even in years where the index ultimately ended higher. The bottom line is that market selloffs should be the expectation, not the exception.
Annual Market Performance (grey bar) and Intra-Year Decline (red dot)

Source: JP Morgan Asset Management, Guide to the Markets, Q4 2024, As of September 30, 2024.
Think of it like this: People living in Toronto might not like cold, snowy days. But come January, when the weather is cold or snowy, they aren’t surprised by the weather. And, those folks also know that the winter weather will pass, and that they’ll eventually enjoy a beautiful summer day. It’s the same way with markets; selloffs are part of the deal, but a century of experience shows us that markets eventually stabilize and resume their long run upward trend.
Q: Well, if the market might fall, should I try and time it?
A: Only if your timing is perfect.
The reality is that a huge percentage of market returns are generated during a small subset of trading days, which means that if those are the days you aren’t invested, your returns drop sharply. In fact, missing just 10 days over a two-decade period cuts returns in half. Missing the best 60 days cuts wealth by more than 90%!
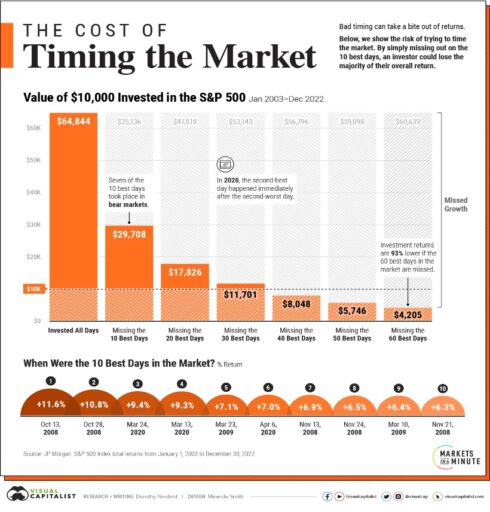
Source: Visual Capitalist, Timing the Market: What It’s So Hard, in One Chart, August 2023.
Importantly, look at when the best days occurred – they were all during the Great Financial Crisis or COVID, which are the periods market timers were probably most likely to be out of the market!
Q: What about diversification? AI and Tech are all the rage. What’s the real downside of concentrating there?
A: The downside is possibly not retiring (or going back to work if you’re already retired.)
It can be tempting to invest in what’s done well lately, but there are numerous examples of times that wouldn’t have worked out. One that happened to involve tech stocks was the 1990s dotcom boom, which featured soaring values of many early internet companies. Of course, when that bubble burst in the early 2000s, the S&P 500 went on to post a full decade of negative returns (tech stocks themselves did even worse.)
Ask yourself this: What would a full decade of negative returns do to your retirement plans?
Performance of Various Asset Classes (2000-2009)

Source: Dimensional Fund Advisors; A tale of two decades: Lessons for Long-Term Investors, February 2020.
The interesting thing about that decade is that even as the S&P and Nasdaq were stagnating, many other asset classes posted solid (and at times spectacular) returns. The end result was that diversified investors didn’t have nearly as much fun during the 1990s, but they also didn’t suffer nearly as bad a hangover when the clock struck midnight.
Q: I heard even the Oracle of Omaha is selling stocks. Should I follow Warren Buffett’s lead?
A: Not unless your account is similar in size to his.
The graphic below shows a sampling of recent headlines around the famous ‘Oracle of Omaha’s’ recent stock sales.

But, before you follow Buffett’s lead, there are a couple things you may want to consider. The first, and most important, is that Buffett himself has repeatedly stated that he cannot time markets and does not know where stock prices are headed.
The second important consideration is that your opportunity set as an investor differs greatly from Buffett’s. The Oracle himself has alluded to this over the years, stating that he doesn’t expect his future performance to be as good as in the past, simply because his portfolio has gotten so big. Buffett’s size means that he needs to focus on a small subset of companies, some of whose prices might currently be elevated.
However, as an individual investor, you have a broader menu to choose from. In addition to large U.S. stocks, you can also consider smaller U.S. companies and the universe of global offerings. Many of these companies have stock prices that remain fairly valued.
Q: I’m worried about the direction the country is taking. What should I do?
A: The best advice is often, “Don’t just do something, stand there.”
There was a famous study that looked at how various asset classes and portfolio allocations did during the first two decades of the 21st Century and then compared that to how the average investor had done. During that time frame some asset classes (such as REITs, Emerging Market Stocks, and Small Company Stocks) did better than others. Over different time horizons, the best or worst performing asset classes are likely to fluctuate.
But the important takeaway is that the average investor did far worse than almost any asset class. So yes, overweighing a particular ‘winner’ can help returns. But the real key is to avoid the critical mistakes average investors make. That means not giving in to the temptation to pile into recent winners, or to become too aggressive in bull markets or too conservative in bear markets.
Asset Class and Average Investor Returns (1st Two Decades of 21st Century)

If, after considering the above, you still want to consider changes to your portfolio, here are several considerations:
- If you change your asset allocation, do so modestly. For instance, in some circumstances a shift from 60% stocks to 70% or 50% could make sense. but there are seldom situations where moving from all stocks to all cash or vice versa makes sense. Institutions, driven by their Investment Policy Statement, generally follow the former approach. Individuals, driven by emotion, sometimes follow the latter, to their detriment.
- Consider adding non-correlated assets to your investment mix. Over the last several years, some investments that had previously only been available to large institutions have been made available to individual investors these “alternative investments” aren’t right for everyone, but in some circumstances, they can add diversification to a portfolio, potentially providing a smoother ride along your financial journey.
- Sometimes individual securities make sense. Exchange Traded Funds (ETFs) and Mutual Funds are great, but in some instances, it can make sense to incorporate individual stocks or bonds to your investment mix. Doing so can potentially provide more control over future cash flows, more visibility into underlying holdings, and, in a down market, more tax loss harvesting opportunities.
- Re-run your financial plan for peace of mind. One of the key benefits of financial planning is the opportunity to continually monitor your progress towards your financial goals. This is particularly true since financial plans are built with the understanding that markets will be volatile, and that the plan requires a margin of safety to account for this. With that in mind, re-running your financial plan to see what impact various outside events or developments might have can provide peace of mind that you’ll be ok, whichever way the wind blows.
The Bottom Line
The bottom line is that there is always uncertainty in the world. Its also true that consumer sentiment surveys taken over the decades have repeatedly shown that people feel more confident when their preferred candidate is in office, and less so when a candidate they dislike is in office. But despite personal opinion, the evidence is conclusive that in most instances the best advice is to maintain a disciplined, long-term investment approach. It also usually makes sense to re-examine your financial plan to make sure you are still on track, as well as to evaluate your asset allocation to make sure you are still targeting an appropriate level of return and risk. And finally, in some circumstances you might want to consider modest portfolio changes such as adding alternative investments or individual securities.
Next Steps:
- Re-run your financial plan to see if you’re still on track to meet your financial goals.
- Review your investment holdings and asset classes to see if there are any others that might enhance your portfolio.
- Take a deeper dive into your overall financial situation using our free Financial Blueprint.