“Inflation is raging. There might be a recession. Markets are volatile. An election is on the horizon. Several banks have failed. We might hit the debt ceiling. Russia is still invading Ukraine. China might invade Taiwan.”
The list goes on and on, a litany of troubling headlines. It’s enough to keep you up at night. Enough to make you abandon your investments and move to cash. But should you? Well, for starters, it turns out that despite the general negativity, returns in 2023’s first quarter were uniformly positive, as you can see from the year-to-date column below:
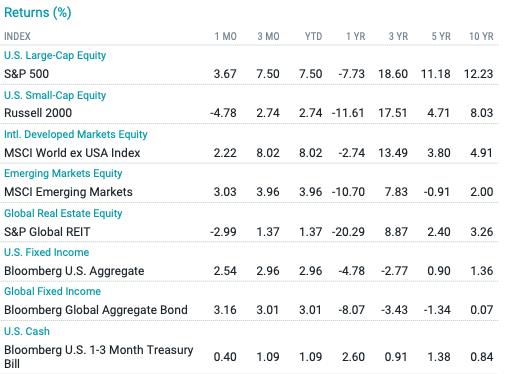
Sources: FactSet; Avantis Investors, Monthly ETF Field Guide, March 2023.
Now, look again at the chart above, this time focusing on the 3-year column. The past three years have included a global pandemic, the highest inflation in forty years, and one of the sharpest interest rate increases on record, not to mention the largest land war in Europe since WWII. Despite that, major stock indexes have risen during that period, and even bonds, which were hindered by low starting yields and those sharply rising rates, ‘only’ declined around 3%.
When Will the Lights All Turn Green?
Considering the last several years leads to another point. Because, while there is no denying that there is a lot of bad news floating around, ask yourself this: When, in your lifetime, has the news all been good?
Honestly, has there ever been a time when the lights were all green, the wind was at your back, the sky was blue, and there were no clouds on the horizon? Such environments only exist in an idealized past, and the reality is that there are always things to be concerned about whether politics, the economy, financial market performance, international affairs, or the latest technological advancement sure to displace workers and lead to a dystopian future.
With that in mind, look at how a single dollar would have grown, if invested in a global stock index in 1970. By the end of 2021, that single dollar would have turned into $98. And that’s despite an almost constant litany of bad news and challenges, as you can see below:
Markets Have Rewarded Discipline (1970-2021)
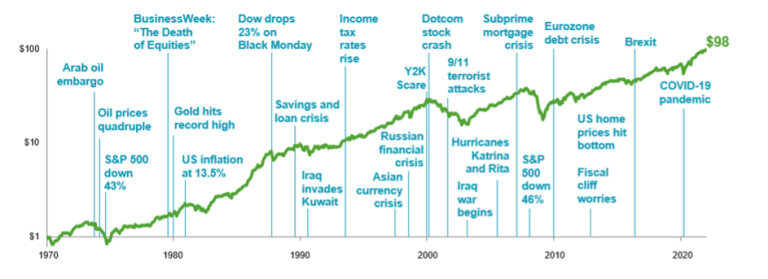
Source: Dimensional Fund Advisors. In US dollars. MSCI data © MSCI 2022, all rights reserved. Indices are not available for direct investment. Their performance does not reflect the expenses associated with the management of an actual portfolio.
That is why there is a famous saying among investors: The Market Climbs a Wall of Worry.
The point is that when everyone is optimistic, there is no one left to buy. But when investors are collectively nervous, there tends to be a lot of dry powder on the sidelines. That means that when the news turns slightly better – not necessarily great, just slightly better – investors come into the market, and prices move higher.
Consumer Confidence and the Stock Market
This concept is demonstrated by the chart below which measures consumer confidence against subsequent stock market returns. Following the nine instances when sentiment peaked, the S&P 500 averaged 3.5% returns for the following 12 months. But, after the eight instances in which sentiment bottomed out, the stock market averaged 24.9% returns for the following 12 months.
In other words, the stock market did 7x better when people were the most pessimistic as compared to when they were the most optimistic.
Consumer Sentiment Index and Subsequent 12-month S&P 500 Returns
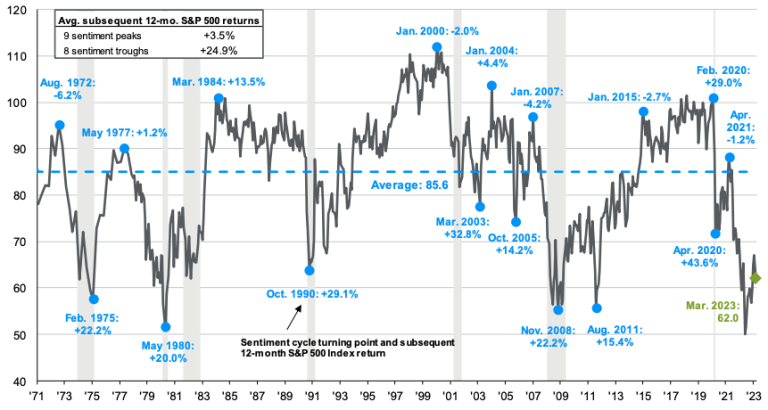
Source: JP Morgan Asset Management, Economic and Market Update, March 31, 2023.
The Road Ahead
No one knows where markets are going, nor whether the news cycle will get better or worse. But, in March of 2023, consumer confidence hit lows not seen since 1980. Can it head lower? Sure.
The takeaway isn’t that consumer confidence and financial markets have hit bottom, and that now is the time to become more aggressive. Rather, the conclusion is that this isn’t the time to abandon your plan or your investments because, while the timing is uncertain, history does tell us that periods of worry usually coincide with periods of opportunity.