If you looked at your statements late last year, you know that 2022 was tough for investors. The stock market, as measured by the S&P 500, declined nearly 20%.
S&P 500 – 12 Months (as of 1/24/2023)
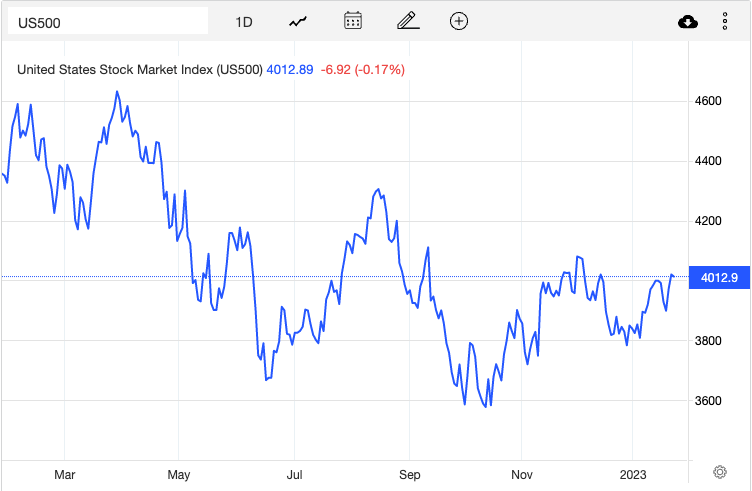
The Standard & Poor’s 500 (S&P 500) Index is an unmanaged composite of large capitalization companies. Indices are not available for direct investment. Their performance does not reflect the expenses associated with the management of an actual portfolio. Past performance is not a guarantee of future results. Index returns are not representative of actual portfolios and do not reflect costs and fees associated with an actual investment. Actual returns may be lower. Intended for educational purposes only and are not intended as individualized advice or a guarantee that you will achieve a desired result.
However, what made 2022 an unusual year was that even as stocks were falling, there was almost no place to hide. During the COVID bear market of 2020, the Financial Crisis of 2008-2009, or the Dotcom meltdown of the early 2000s, high quality bonds provided ballast to diversified portfolios, giving investors a source of stability during volatile periods. In contrast, 2022 featured the worst bond market performance on record, with the Bloomberg Barclays Aggregate Index falling approximately 14%.
S&P Intra-Year Declines vs. Calendar Year Returns
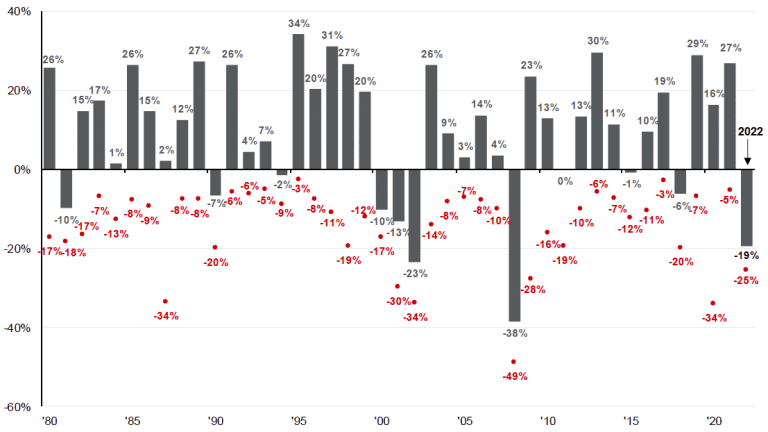
Bloomberg, FactSet, JP Morgan Asset Management. Returns are based on total return. Intra-year drops refers to the largest market drops from a peak to a trough during the year. For illustrative purposes only. Returns shown are calendar year returns from 1976 to 2022, over which time period the average annual return was 6.6%. Returns from 1976 to 1989 are calculated on a monthly basis; daily data are used afterwards.
US Data are as of December 31, 2022.
Is the 60/40 Portfolio Dead?
The combination of falling stocks and falling bonds called into question whether diversified portfolios still make sense. For instance, a mix of 60% in the S&P and 40% in the Barclays Aggregate would have declined by 16% last year, one of the worst performances on record.
60/40 Returns Since 1950
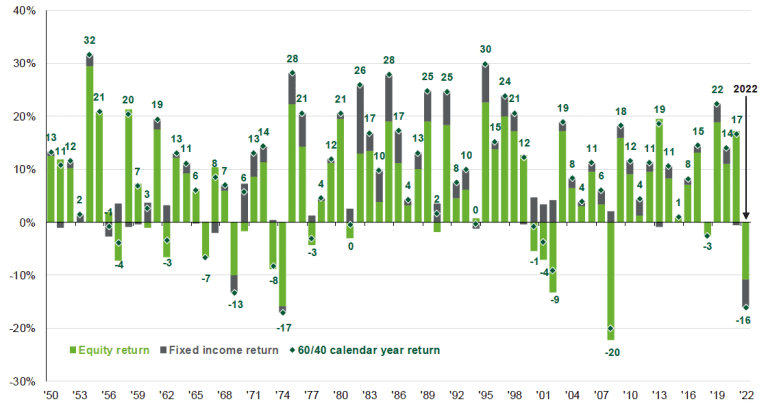
FactSet, Standard & Poor’s, Robert Shiller, Yale University, Bloomberg, Ibbotson/Strategas, JP Morgan Asset Management. The 60/40 portfolio is 60% invested in S&P 500 Total Return Index and 40% invested in Bloomberg US Aggregate Total Return Index, S&P 500 returns from 1950-1970 are estimated using the Shiller S&P Composite. US fixed income total returns from 1950-1975 are estimated using data from Strategas/Ibbotson. The portfolios are balanced annually.
US Data are as of December 31, 2022.
But look at the chart another way. Look at how many years the blended portfolio produced positive returns and how infrequently it posted declines. Successful investing is an exercise in probabilities; no strategy works all the time. The goal is to find strategies that work more often than not, properly control your downside risk, and then stick with the strategy over time. The chart above fulfills those requirements. That is not to say that a 60/40 mix is right for most people. That particular blend is used here just for the purposes of illustration. But the bottom line is that having a combination of various asset classes makes sense for most people – unless they have a crystal ball!
Why Not Pick a Single Asset Class?
Well, again, if you have a crystal ball, you should just pick whatever asset class is going to do best next year. But look at the chart below, which stack ranks various asset classes each year in order of their performance.
Asset Class Returns
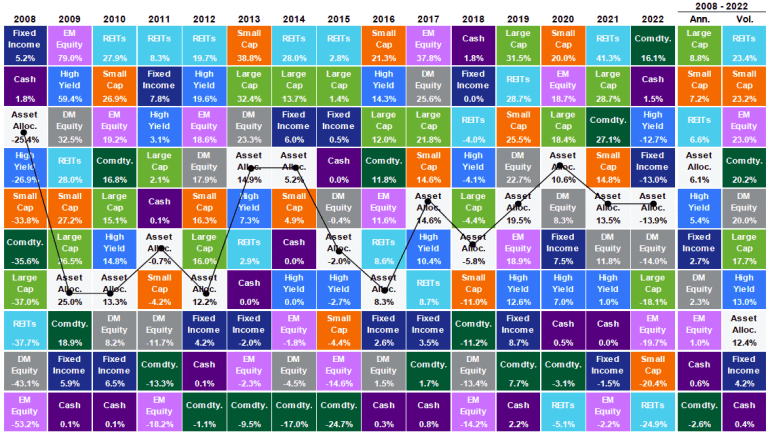
Bloomberg, FactSet, MSCI, NAREIT, Russell, Standard & Poor’s, JP Morgan Asset Management. Large cap: S&P 500; small cap; Russell 2000, EM Equity; MSCI, EME, DM Equity; MSCI EAFE, Comdty: Bloomberg Commodity Index, High Yield: Bloomberg Global HY index, Fixed income; Bloomberg US Aggregate, REITs NAREIT Equity REIT Index, Cash; Bloomberg 1-3m Treasury. The “Asset Allocation” portfolio assumes annual rebalancing. Annualized (Ann.) return and volatility (Vol.) represents period from 12/31/2007 to 12/31/2022. All data represents total return for stated period. The “Asset Allocation” portfolio is for illustrative purposes only. Past performance is not indicative of future returns. US Data are as of December 31, 2022.
The takeaway, if you are looking for one, is that there is no particular pattern. Just because something did well one year doesn’t give an indication of whether it will continue to do well. Similarly, poor performance can lead to either continued weakness or a significant rebound. You can see the black line marked “asset allocation” running through the chart. Its performance is never the best, but importantly, it is also never the worst. That blended return, with a risk level you can live with, is often the key to meeting your financial goals.
Beware of Sector or Single Stock Risk
Even within an asset class, diversification makes sense. Consider the stock market. The technology sector was the top performer for several years running, leading many investors to concentrate their holdings there.
Then this happened:
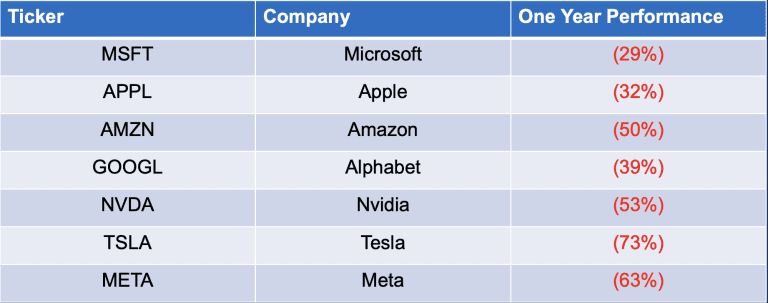
For the twelve months ended 1/3/2023, the seven largest tech stocks fell an average of 48%, while the Dow Jones Industrial Average fell approximately seven percent.
Different types of stocks also perform differently. For instance, in 2022, Value stocks (the left-hand column below marked “V”) significantly outperformed Growth stocks (the right hand column below marked “G”.) This isn’t always the case of course (though Value stocks have posted higher returns across time), and so it makes sense to incorporate both Value and Growth stocks in a portfolio, as well as Small and Large companies (the “S” and the “L” in the table below.)
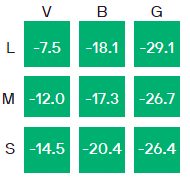
Weekly Market Recap as of 1/2/2023
Does Global Investing Still Make Sense?
What about global diversification? Does it still make sense to invest abroad following an extended run of outperformance by U.S. stocks? Well, for starters, consider some of the great companies not domiciled in the United States:
- Nestle
- Novartis
- Toyota
- Unilever
- LVMH
- BHP
- Sony
- SAP
Because those companies are in other countries, U.S. centric investors would miss out on their future growth. Additionally, over time foreign markets and the Untied States tend to rotate periods of outperformance. For instance, look at the COVID year of 2020:
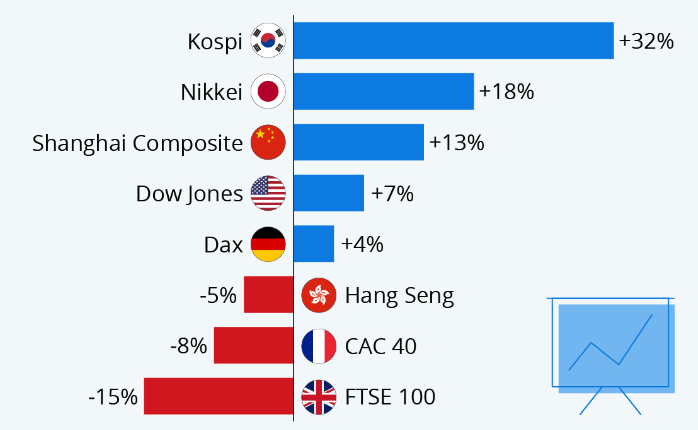
While the U.S. market managed to post positive performance despite the pandemic, there were other countries (Korea, Japan, China) that did better. And there were countries (France, Britain) that did worse. The point is that having exposure around the globe allows you to participate in the long-term growth of more companies, as well as in a wider variety of countries and markets. Again, as with any diversification strategy, this may not produce the absolute highest returns, but it can provide cushion against extreme lows while also potentially reducing volatility.
So What’s the Bottom Line on Diversification?
The bottom line is that even following a difficult year for most asset classes, diversification still makes sense for investors with a long-term time horizon. No, diversification won’t produce the highest returns. Having a crystal ball, and consistently picking the single best stock, asset class, or country will do that.
But since almost no one has the ability to perfectly predict the future, for most people diversification makes sense. Sure, that approach might lower the bar on potential returns, but it also raises the floor and guarantees you won’t be concentrated in the worst performing market, sector, or security.
For most people seeking a path to financial success, achieving reasonable returns with a moderate amount of risk provides an approach they can stick with over time. And that, in turn, dramatically increases the odds of meeting their financial goals.